Daylight Sensor Details
I've been recording data from a remote sensor
since last September and have now converted that sensor to measure daylight entering my shop through a window.
Every night I run a script,
nightly,
that converts the day's samples into a column of pixels and adds that to the right side of a cumulative image.
The script runs a perl program,
bsdtoraw,
to parse and scale the data.
It then feeds this into a pipeline of
portable pixmap
commands.
This is that image converted to JPEG and stretched by the browser to viewable dimensions.
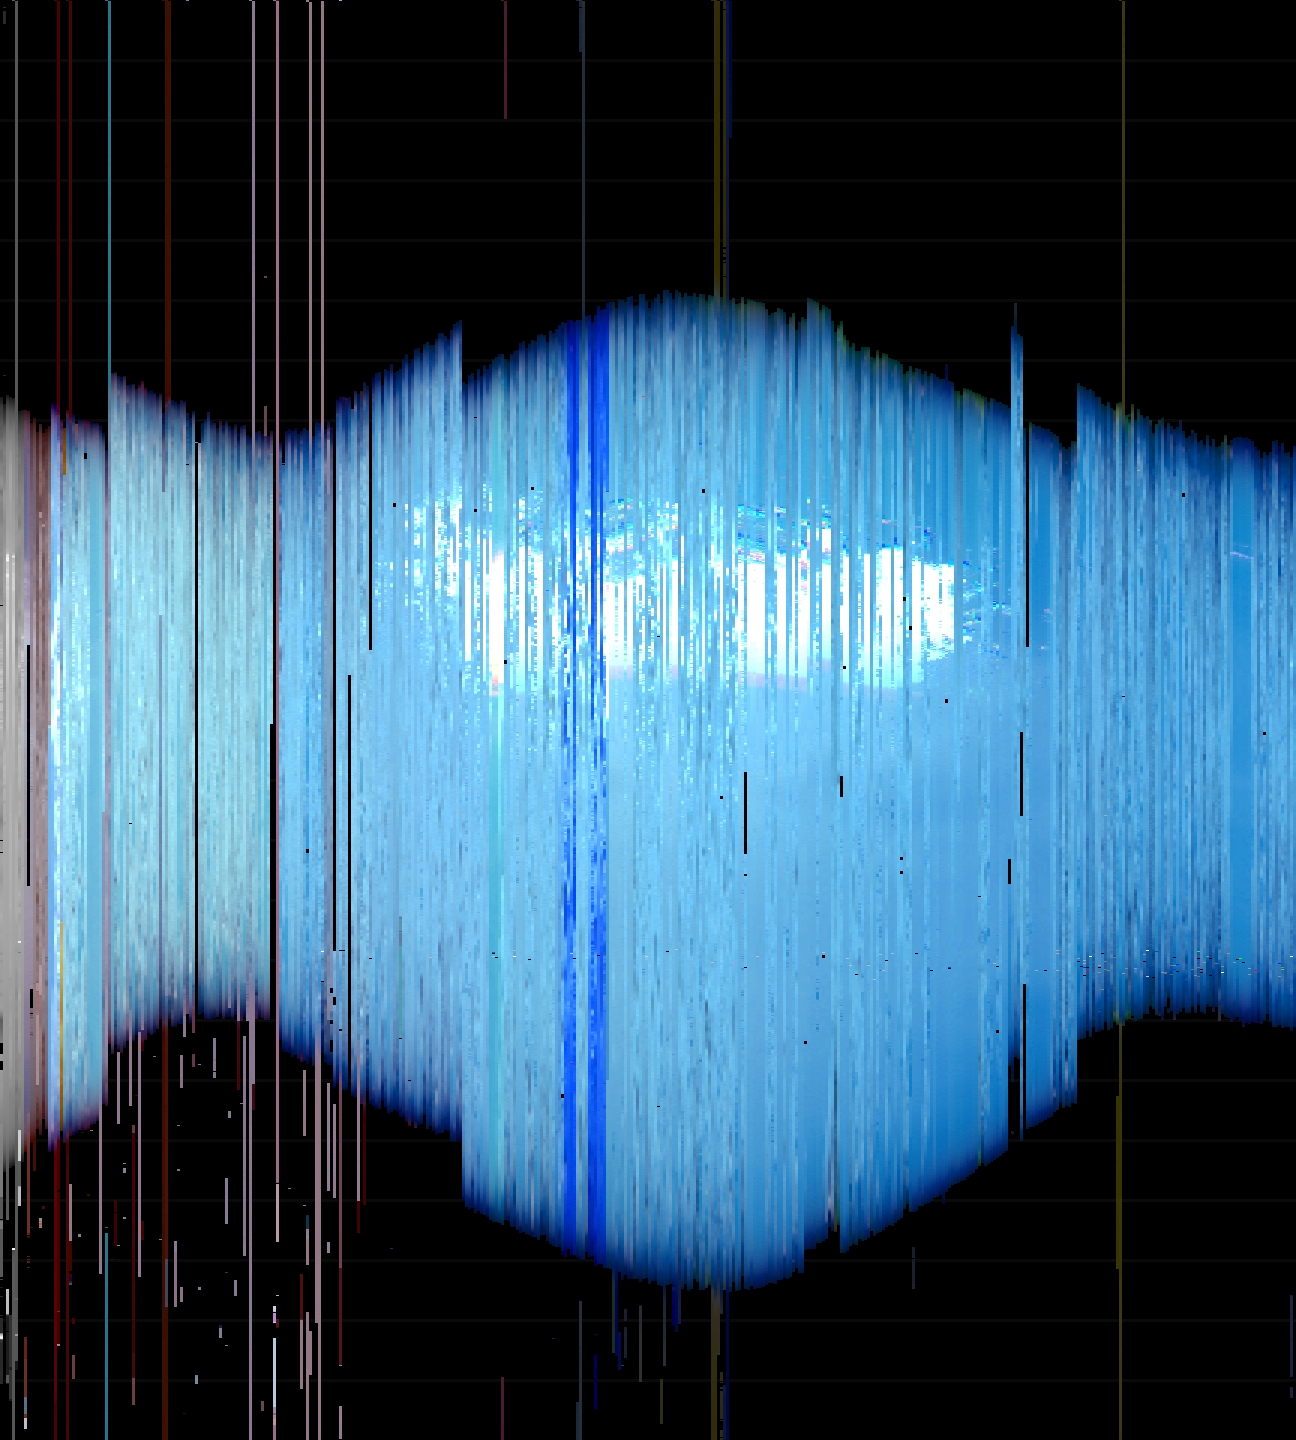
magnify
You can see successive sunrises along the top of this image and sunsets along the bottom.
The scale at the right will help you determine when each occures.
Compare this to civil twilight predictions
computed by the U. S. Naval Observatory.
I'm exploring these and related calculations in a spreadsheet based on Fiona Vincent's
lecture notes
on positional astronomy and reverse-engineering Jarmo Lammi's
photoperiod calculator.
download 500K
Color
I started out in black & white but have now converted my whole setup to color.
I use three CdS photo cells that I tune for each channel with red, green and blue photographic filters.
(Ed Scott and Hollis Bewley explain why these colors work;
Kolb, Fernandez and Nelson document the vertebrate retina.)
Here is one day's data recorded from dawn to dusk.
Direct sun caused these mid-morning ragged peaks.
Clouds can cause ragged valleys.
Most data has been acquired with my circuit watching
the color of the light on my white ceiling.
The daylight came past the tall trees by the creek,
in my east-facing windows, through pink mini-blinds
and off the white carpet before it got to the ceiling.
To help interpret these rather indirect observations
I white-balanced the data with post-processing software
and boosted the saturation by 3X too.
The data has been contaminated by incandecent and floresent
lights in the room and adjacent hallway.
Gaps in the data are the result of server reboots,
power outages or other interruptions of service.
Visible events include:
- 09/19/98 -- Started recording.
- 09/23/98 -- Room lights left on through following day.
- 09/27/98 -- Sensor converted to color.
- 09/28/98 -- Power fails. Acquisition restarted 4hr later.
- 09/29/98 -- Brief outage as sensor and server moved to corner of room.
- 10/01/98 -- First of several dark and rainy days.
- 10/05/98 -- Sensor moved to window sil with direct view of sky.
- 10/09/98 -- Blue cell damaged by lowered blind. Repaired next day.
- 11/24/98 -- Yesterday's data obliterated through an unlikely chain of events.
- 02/15/99 -- Server relocation interrupts data collection for weeks.
- 03/04/99 -- Sensor sheilded from room lights. Data much improved.
- 04/18/99 -- Mounting fails breifly exposing sensor to room light.
- 05/08/99 -- Blue filter knocked loose. Blue over reported for days.
- 05/16/99 -- Blue filter loose again. Will try different glue.
- 07/08/99 -- Twelve minute clock skew throws data off for two weeks.
- 10/10/00 -- Cat yanks serial cable loose. Lost five days of data.
The data is also degraded by the compression inherent in web standard image
formats. I've chosen JPEG because it can represent many colors at the expense
of some bleeding between adjacent pixels. I now repeat pixels before compressing to make areas of bleed obvious.
Circuit
I use the following circuit to make the measurements.
The controller's
PBASIC
software,
color.bs2,
charges the capacitor through P0 then times how quickly
it discharges through P5, P6 or P7.
It also talks RS-232 to the server through P1 and P2.
I've devised an integer-rational sampling scheme that maintains
1% precision over 50000X dynamic range.
The parts I used can be purchased from these sources.
© 1998,
Ward Cunningham